
This article was published by the Canada Energy Regulator on June 4, 2025.
In 2024, Canada experienced strong growth in natural gas liquids (NGLs) exports, driven by increased natural gas production in Alberta and British Columbia. This rise in gas output led to greater production volumes of NGLs, including propane and butane. Daily exports of Canadian NGLs in 2024 averaged 218.3 thousand barrels per day (Mb/d) for propane and 56.1 Mb/d for butane, representing an 9.2 per cent increase for propane and a 15.0 per cent increase for butane from the previous year’s volumes.
In 2024, the average export price of propane rose to 33.93 Canadian cents per litre (¢ /L), up from 30.31 ¢ /L in 2023. The total value of propane exports reached $4.31 billion (3.15 billion USD(1)) in 2024 , an increase of 22.6 per cent from the previous year.
In 2024, the average export price of butane was 31.79 ¢ /L, slightly up from 31.28 ¢ /L in 2023. The total value of butane exports reached $1.04 billion (0.76 billion USD) in 2024, an increase of 17.2 per cent from the previous year.
Figure 1: Propane and Butanes- Exports by Year or Month
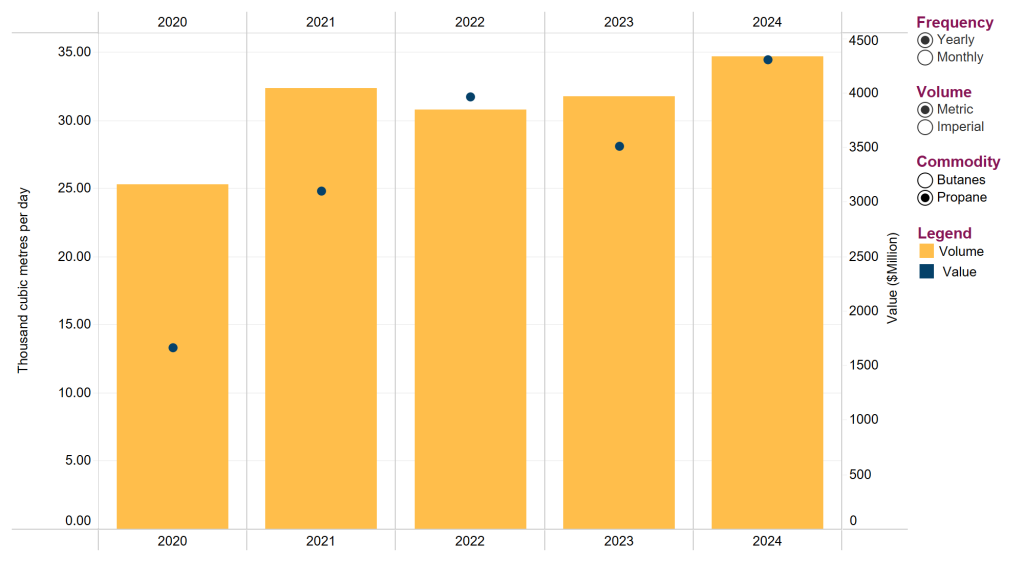
Text Alternative: This figure shows yearly and monthly Propane and Butanes exports over a five-year period in thousand barrels per day or thousand cubic metres per day. For the latest export data, including updates and revisions, please see the Commodity Statistics page. To see an animated version of this graph, click here.
In 2024, 57.7 per cent of Canada’s propane exports went to the U.S. This was a slightly lower share than 2023, even though total volumes to the U.S. rose by 8.6 per cent . Within the U.S., imported volumes varied by region: 25.9 per cent went to Petroleum Administration for Defense District (PADD)(2) I (with volumes up 31.1 per cent from 2023), 31.1 per cent to PADD II (up 11.7 per cent ), 4.4 per cent to PADD III (up 85.9 per cent ), 5.2 per cent to PADD IV (down 28.0 per cent ), and 33.4 per cent to PADD V (down 4.3 per cent ). The share of propane exports to non-U.S. markets grew slightly in 2024, to 42.3 per cent from 41.8 per cent in 2023. These exports, which grew by 10.8 per cent , went to non-U.S. markets such as Japan, South Korea, and Mexico.
In 2024, all of Canada’s butane exports went to the U.S., with different regions receiving varying volumes. Specifically, 8.3 per cent was delivered to PADD I (with volumes down 3.4 per cent from 2023), 31.7 per cent to PADD II (up 28.8 per cent ), 2.3 per cent to PADD III (up 45.6 per cent), 5.0 per cent to PADD IV (up 45.4 per cent ), and 52.6 per cent to PADD V (up 8.7 per cent ).
Figure 2: Propane and Butanes Export Volumes to U.S. by Region
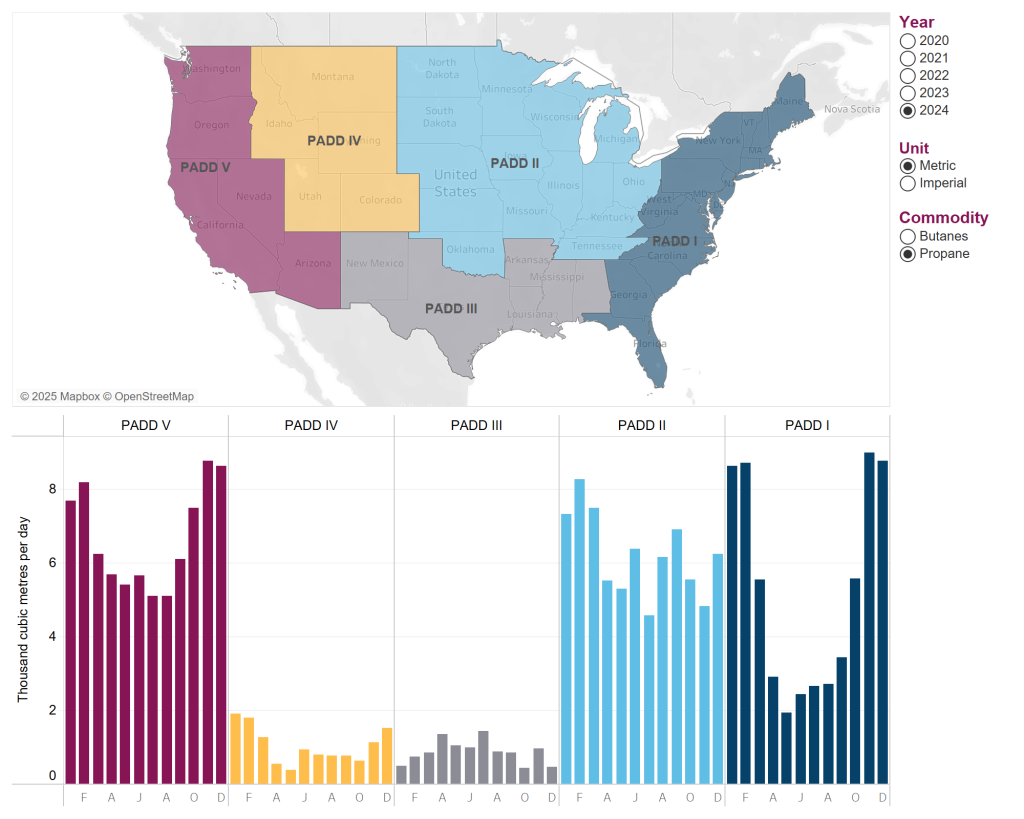
Text Alternative: This figure shows monthly exports over a five-year period from Canada to five U.S. Petroleum Administration for Defense Districts (PADDs). For the latest export data, including updates and revisions, please see the Commodity Statistics page. To see an animated version of this graph, click here.
In 2024, rail was the primary mode of transportation for Canadian propane and butane exports, accounting for 49.0 per cent and 90.5 per cent , respectively. Marine shipments made up 40.8 per cent of propane exports. Since 2020 Canada has become the second largest supplier of propane to Japan and South Korea, after the U.S. The Ridley Island Propane Export Terminal (RIPET) in Prince Rupert, British Columbia, began operating in May 2019 and now ships propane directly to Asia. The Ferndale terminal in Washington State also helps to move Canadian propane to Asian markets. Pipelines transported 7.1 per cent of propane and 9.2 per cent of butane. Truck exports were minimal, representing just 2.9 per cent of propane and 0.2 per cent of butane(3).
Western Canada and U.S. West Coast LPG Terminals
Canada’s propane export infrastructure has expanded rapidly in recent years, driven by a growing network of operational and developing Liquified Petroleum Gas (LPG) export terminals on the B.C. coast. These facilities play a key role in supplying propane to international markets, especially in Asia, given its proximity to eastern Asia markets compared with U.S. Gulf Coast LPG export facilities.
Canada currently operates two marine propane export terminals: the 80 Mb/d Ridley Island Propane Export Terminal (RIPET) and the 25 Mb/d Prince Rupert Terminal. Both terminals receive propane delivered by rail from Western Canada. Propane comes mainly from natural gas processing and oil refining, with large production areas in Alberta and northeast British Columbia. Two additional LPG export terminals are under development: the Ridley Island Energy Export Facility (REEF), a joint project by AltaGas and Royal Vopak (50 to 60 Mb/d), and the 67 Mb/d Trigon Pacific LPG, led by Trigon Pacific Terminals Limited. REEF is currently under construction and is expected to start operations by the end of 2026(4), and Trigon plans to start operations in 2028, pending regulatory approvals. In addition, the 75 Mb/d Ferndale LPG Export Terminal in Washington State (PADD V), operated by AltaGas, also exports Canadian propane to Asian markets. In Washington State (PADD V), operated by AltaGas, also exports Canadian propane to Asian markets.
Figure 3: Propane and Butanes Exports by Mode of Transportation
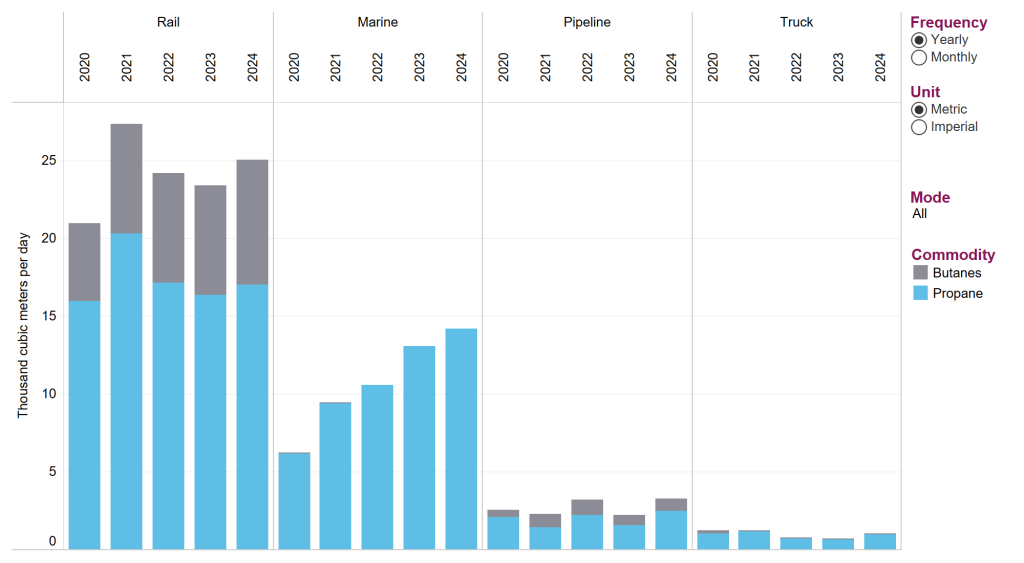
Text Alternative: This figure shows Propane and Butanes Exports by Mode of Transportation over a five-year period. For the latest export data, including updates and revisions, please see the Commodity Statistics page. To see an animated version of this graph, click here.
For more information on the Canada’s natural gas liquids trade, please visit the Propane and Butanes Export Summary.
Footnotes
- Using average exchange rate for 2024
- U.S. Petroleum Administration for Defense Districts (PADDs) are geographic aggregations of the 50 U.S. States and the District of Columbia into five districts: PADD I is the East Coast, PADD II the Midwest, PADD III the Gulf Coast, PADD IV the Rocky Mountain Region, and PADD V the West Coast. PADDs were originally developed in the 1940s to help geographically ration fuel in the event of war. U.S. oil data is tracked by PADD.
- Numbers may not add due to rounding.
- REEF received Final Investment Decision (FID) in May 2024.

Be the first to comment