")
This article was published by the Canada Energy Regulator on June 18, 2025.
In 2024, virtually all of Canada’s natural gas exports went to the United States (U.S.), with exports averaging 8.8 billion cubic feet per day (Bcf/d) – the highest level since 2010. This marked an 8.1 per cent increase from the previous year. A mild winter in Canada and record natural gas production(1) in western Canada led to increased supply available for export. Additionally, relatively low gas prices in Canada made Canadian natural gas more competitive, while extremely cold weather in parts of the U.S. increased demand for heating. At the same time, the value of Canadian natural gas exports fell by one-third in 2024, due to a sharp decline in export prices.
Exports accounted for 47.8 per cent of Canadian gas production in 2024, a 2.6 per cent increase from the previous year and a 3.5 per cent rise compared to 2020.
Figure 1: Natural Gas Exports Volumes
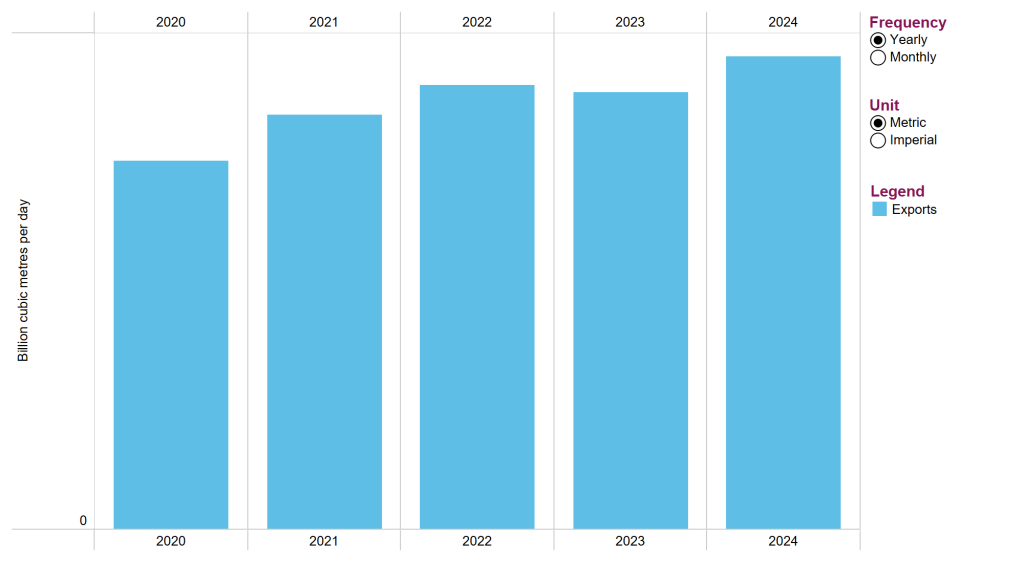
Text Alternative: This figure shows yearly and monthly natural gas exports over a five-year period (from January 2020 to December 2024), in billion cubic feet per day and million cubic metres per day. For the latest export volume data, including updates and revisions, please see the Commodity Statistics page. To see an animated version of this graph, click here.
In 2024, Canada transported 99.9 per cent of its exported natural gas via pipelines, all of which flowed to the U.S., with volumes varying across U.S. regions. Of Canada’s natural gas exports to the U.S. in 2024, 45.8 per cent went to the Midwest, 41.2 per cent to the West, and 13.0 per cent to the East. Compared to 2023, exports to the Midwest rose by 8.1 per cent, to the West by 2.3 per cent, and to the East by 32.6 per cent.
Figure 2: Export Volumes to U.S. by Region
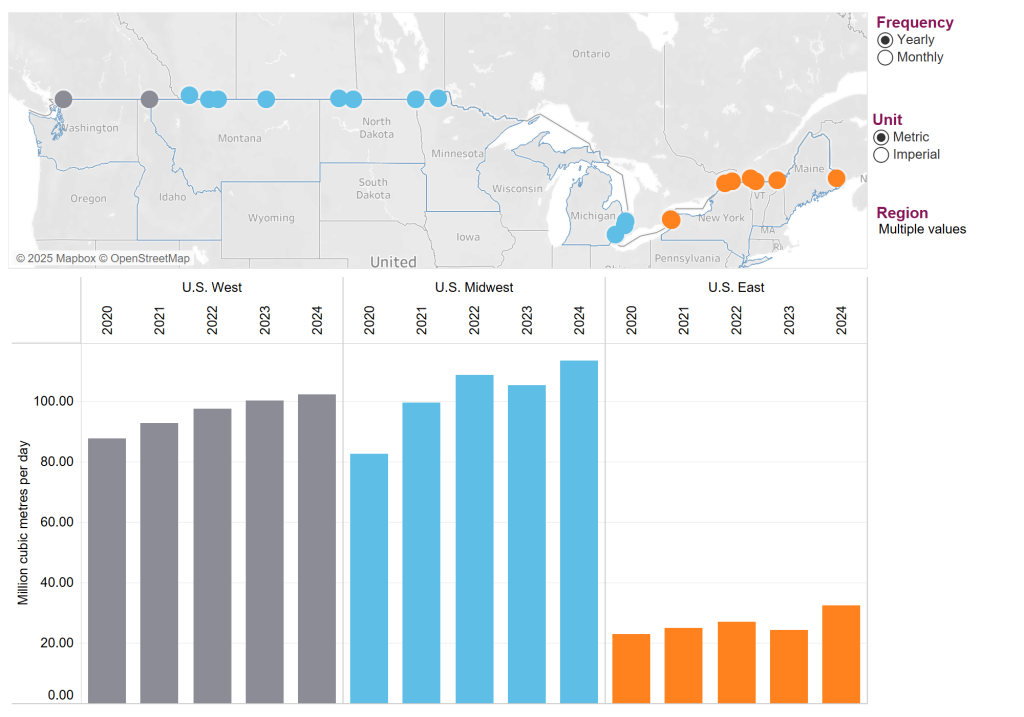
Text Alternative: This figure shows yearly and monthly natural gas exports over a five-year period from Canadian provinces to three U.S. geographical regions: the U.S. West, U.S. Midwest, and U.S. East in billion cubic feet per day and million cubic metres per day. For the latest export volume data, including updates and revisions, please see the Commodity Statistics page. To see an animated version of this graph, click here.
In 2024, the average price of natural gas exported was $2.49(2) per Gigajoule (GJ), down from $4.04 per GJ in 2023. The total value of these exports $8.9 billion in 2024 – a 33.3 per cent decline from the previous year.
Figure 3: Natural Gas Export Values
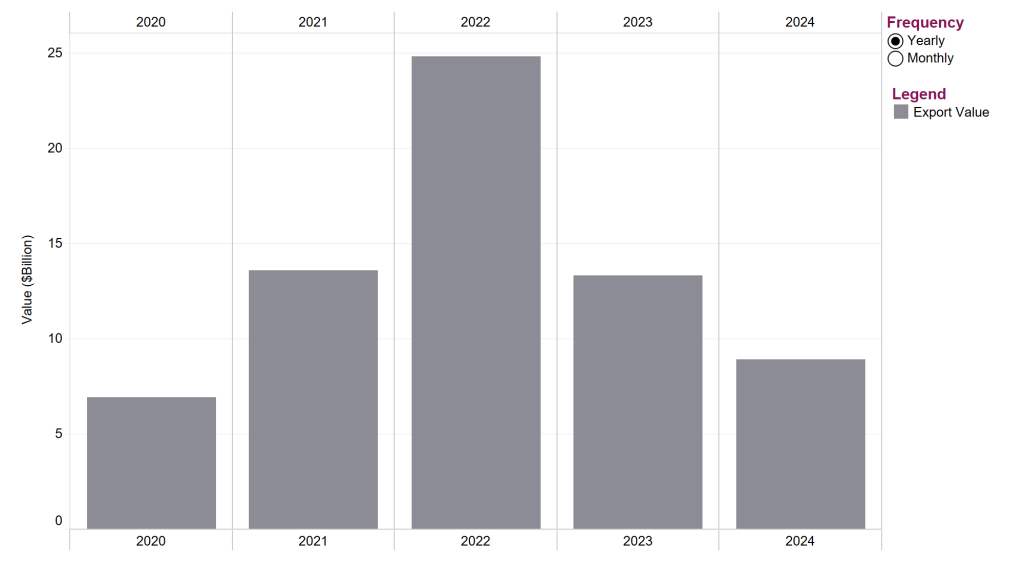
Text Alternative: This figure shows yearly and monthly export values over a five-year period in billion dollars per year. For the latest exports data, including updates and revisions, please see the Commodity Statistics page. To see an animated version of this graph, click here.
Whereas over 99.9 per cent of Canadian natural gas exports went to the U.S. in 2024, Canada will begin exporting material volumes of natural gas to countries beyond the U.S. in 2025. This change comes with the expected startup of LNG Canada, a new LNG export facility in Kitimat, British Columbia.
For more information on the Natural Gas trade in Canada please visit the Natural Gas Trade Summary.
Footnotes
- CER – Marketable Natural Gas Production in Canada
- All prices and values are in CAD.

Be the first to comment